
August 21, 2023
Laser Ultrasonic Inspection of Mash Seam Welds in a Steel Mill
Weld breaks in mash seam welds in continuous sheet metal lines create significant downtime and are frequently caused by incomplete fusion and insufficient weld nugget size. A laser ultrasonic technology, which is a non-contact volumetric inspection method capable of measuring on moving targets at high temperatures, was evaluated for the in-line inspection of mash seam welds of a low-carbon steel base material in a blind test. Good correlations were found between the laser ultrasonic inspection results and the results from traditional inspection methods and destructive tests.
Keywords: coil joining, weld inspection, resistance seam welding, ultrasonic testing, steel making
(Note: Weldspector is a product under development by Tecnar)
Laser Ultrasonic Inspection of Mash Seam Welds in a Steel Mill
Morgan Hiraiwa1, Hao Guo2, Alexandre Nadeau1, Andrew Grasley2, Matthew Stautz2
1 Tecnar Automation Ltée
1021 Marie-Victorin Street
Saint-Bruno, QC, Canada J3V 0M7
Phone: (450) 461-1221
Email: sales@tecnar.com
2 Cleveland-Cliffs Inc.
Suite 3300, 200 Public Square, Cleveland, OH, USA, 44114
Phone: (216)694-5700
Email: info@ClevelandCliffs.com
INTRODUCTION
In 2021, the global production of both finished and semi-finished steel reached an estimated 1.82 billion tons, with approximately 436.3 million tons or about 25% being exported1. Of these exported products, around 42% were in the form of steel coils, which are crucial to the continuous processing that the industry relies on to stay competitive. In order to ensure that production runs smoothly without any interruption, it is essential that coils are welded seamlessly. Coil joining is often performed by a variation of resistance seam welding called mash seam welding, which is widely employed in modern continuous steel mills to join steel coils maintaining continuity2, 3.
The welding process leads to rapid and significant metallurgical and thermal-mechanical changes in the base material, which is challenging to control as accurately as the steel making process. Moreover, the weld experiences numerous bending and compressive cycles at high line tension, high temperatures, and corrosive environments, making it the weakest point. Weld failures result in significant downtime, and if not resolved promptly, can lead to prolonged downtime. As such, it is crucial to produce high-quality, defect-free welds. Lack of fusion (LOF) is a common cause of weak welds, which occurs when the weld interface between two coils is inadequately fused, and can result in failures2–5.
Two categories of methods exist to provide on-line monitoring of seam welds: surface or volumetric techniques. Surface techniques obtain thermal information from the coil surface using pyrometers or thermography, which is useful as the weld temperature is a critical parameter for weld quality6, 7. Although surface temperature is linked to internal temperature through heat transfer, it still provides indirect evidence of fusion. Thermal monitoring is prevalent in factories, yet weld breaks still occur, indicating that the picture remains incomplete.
Ultrasonic testing (UT) is a volumetric method that utilizes ultrasound travelling through the thickness of the part being inspected. Interior defects reflect ultrasound, which can be detected by either measuring the back-reflection on one side of the defect or the lack of ultrasound on the other. The most widely used generation and measurement method involves transducers in contact with the metal surface, with the aid of a coupling liquid, which inhibits their use when welds are hot. Although contact ultrasonic transducers have demonstrated significant promise for online seam weld inspection8, a test system installed on a continuous galvanizing line test system had to be located downstream from the welder and added more than 30 seconds per cycle9.
Laser ultrasonic testing (laser UT) is a solution to overcome the limitations of contact ultrasonic transducers. It accomplishes the generation and measurement of ultrasound solely through non-contact optical means10. Laser UT has demonstrated considerable potential in defect detection after decades of extensive research 10–15, and is gaining commercial momentum as manufacturers realize its capabilities16. Tecnar’s Lut for example, has become an industry leader in monitoring seamless steel pipe thickness and eccentricity17. For weld monitoring in coil joining, laser UT systems often have an advantage in working distance compared to other non-contact methods, making it more applicable to measure the weld as it is being made with closed clamps.
In this report, we share the findings of the Weldspector prototype, a laser UT sensor for inspecting weld quality on a continuous galvanizing line. The sensor is a fully non-contact system that can take real-time measurements as a weld is being made, without adding any cycle time, during the forward pass of an overlap resistance seam welder. We conducted live measurements on a series of 11 welds that were created using different levels of welder current to induce defective regions. The results were compared to visual inspection and metallography. We developed an analysis methodology and used 2 of the 11 welds to adjust the weld acceptance threshold. Applying the method to the remaining 9 welds lead to excellent predictions in term of weld soundness, identifying all known lack of fusion defects and exhibiting potential in detecting the transitional state of partial but insufficient fusion state. More than 4 months in the trial period, the system is still on-line to assess stability and develop a database of a broad range of welder and coil parameter.
Experimental methodology
2.1 Weldspector system
Ultrasound is created using a 9 ns 532 nm 25 mJ pulsed laser. A purpose-built pulsed detection laser (PDL) produces 500W of peak power over an 80 µs pulse, with its light split into four fibers (two illumination and two pump fibers) to measure two measurement spots simultaneously. The amplitude of the signal measured before the weld is to know the wave amplitude being traveling toward the weld, which is then compared to the amplitude of the wave after the weld to obtain, such that the transmitted ultrasonic power can be obtained, referred to as simply “transmitted power” from this point on. The reflected light is collected and injected into optical fibers, and sent to the two-wave mixing detection module (TWM), which is a photorefractive interferometer that can measure ultrasound on rough surfaces and is robust against ambient vibrations18.
The probe, shown in Fig. 1a, is responsible for delivery of the laser light to the target and containing the optics for illumination, reflected light collection, and generation beam focusing, as well as the generation laser. The optics are designed to focus the light on the target with the desired spot sizes and spatial layout relative to the weld, as shown in the inset of Fig. 1a.
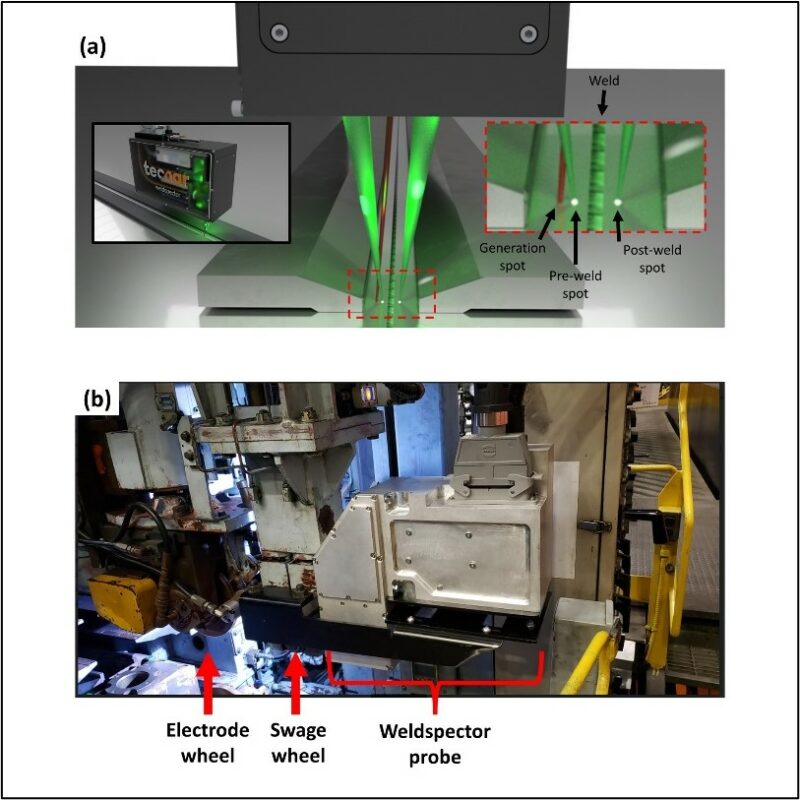
Figure 1. a) Rendering of probe installed over a coil weld with closed clamps. Inset of the left is of the entire probe and inset of the right is of the laser spot layout. b) Picture of probe installed on the swage wheel pillar.
The generated laser beam is focused on the coil surface using a 125 mm lens, creating a 1 mm spot size approximately 7.5 mm away from the weld centerline. The pre- and postweld illumination spots are also 1mm in diameter on the target surface. The pre-weld measurement is located between the generation spot and weld centerline, 3.5 mm away from the centerline such that it measures the wave being sent in the direction of the weld. The postweld measurement location is in the direction of the pre-weld and generation spot and is 12.5 mm away from the preweld spot.
The Weldspector probe is attached to a Mitsubishi MSW-C1 50D26 resistance seam welder at the Cleveland-Cliffs Kote facility (New Carlisle, Indiana). It is mounted on the swage wheel post, opposite to the electrode wheel, as illustrated in Fig. 1b. This position ensures that the coil remains in the focus of the probe optics on the forward pass of the carriage, allowing for real-time measurement while the weld is made.
2.2 Example measurements
A B-scan of a typical postweld is displayed in Fig 2a, which shows time-domain signals measured over a line scan along the entire length of the weld, made from two 0.975 mm thick low-carbon aluminum killed steel coils, with the weld image presented right below it. The weld was visually inspected for debonding or partial cracks after being cut out by the welder machine. The preweld signal is stable throughout the entire length although not presented in the figure (coefficient of variation = 0.12) and the ultrasonic power, defined in the next section, quantifies measured ultrasonic amplitude. A significant decrease in the signal amplitude can be observed along multiple sections, which is expected, considering the weld contained two stamped holes and significant lengths of known defective regions, and will be analyzed in further sections.
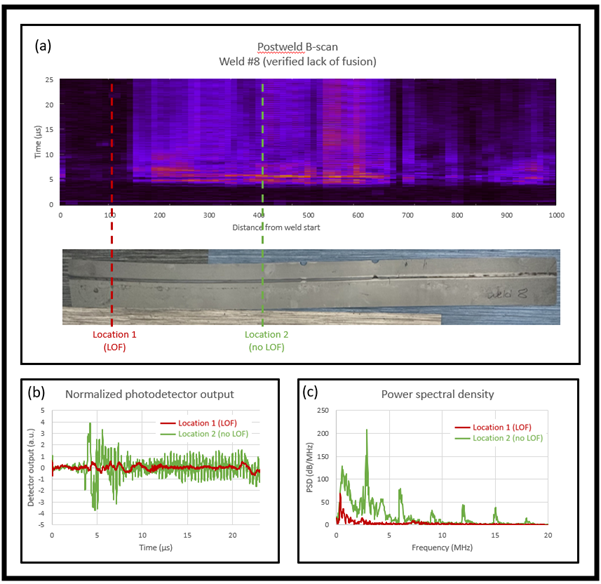
Figure 2. a) Postweld B-scan of a weld in which there were sections of significant lack of fusion. Brighter colors indicate a larger amplitude of the ultrasound. b) Representative postweld A-scan signals at locations with and without verified lack of fusion, shown with red and green, respectively. The locations of these readings are also indicated by the dashed red and green lines in figure 1a. c) Power spectral densities of the signals shown in figure 1b.
Figure 2b displays two postweld signals: one obtained at a position free of defects and another one at a defective position, which has been verified as a location within a large partial crack region identified visually. At a defect-free position (green line), two ultrasonic modes are mainly superimposed. One of these modes is a transient, low-frequency waveform lasting from approximately 3.5 to 8 us, corresponding to the lowest order asymmetric A0 lamb mode (henceforth referred to simply as the “low-frequency pulse”). Superimposed upon that, is a high-frequency, long-lived periodic signals lasting well beyond the end of the recorded time. This high-frequency signal corresponds to the longitudinal echoes travelling back and forth through the sheet thickness of 0.975 mm (henceforth referred to simply as the “high-frequency signal”). While additional shear and mixed-mode waves are present, most of the ultrasonic energy measured fits within this description. At the defective position (red line), there is a significant decrease in the overall signal amplitude, and the signal shape is qualitatively different, with the long-lived signal almost entirely disappearing.
Analyzing the power spectral density (PSD) in the frequency domain provides further insights, as shown in figure 2c. At the defect-free position, the low-frequency pulse has a broadband nature and is centered around 1 MHz. The fundamental of the high-frequency signal is a sharp peak at 2.9 MHz, with higher order harmonics also appearing at lower amplitudes. In contrast, at the defective position, there is a reduction of the low-frequency transient pulse and almost a complete absence of the high-frequency signal. Frequency-dependent transmission of ultrasound across contacting solid-solid bodies with surface roughness has been demonstrated previously, which may explain the attenuation of the high-frequency signal at the defective location19.
2.3 Signal processing decision making hierarchy
To ensure the Weldspector’s viability for overlap seam welds, a robust signal processing scheme is necessary, as shown in Fig. 3. The initial step is to ensure that enough reflected PDL light is collected at the pre- and postweld locations. The amplitude of light reflected on the plate is utilized to establish a rejection criterion. Subsequently, the PSDs are integrated from 2 to 20 MHz to calculate the ultrasonic power of the two measurement locations. The time window for the pre-weld location is 0.5 to 4.2 µs, while it is 0.5 to 17.2 µs for the postweld location. The time windows were chosen to exclude the shockwave arrival in air, which skims the sheet surface and is unrelated to the weld. The analysis is limited to high-frequency longitudinal echoes that are more sensitive to attenuation than low frequencies when two surfaces are in contact19. If the preweld ultrasonic power falls below a threshold, the signal is rejected to ensure enough ultrasonic energy was generated and is travelling towards the weld. Only if it passes this minimum amplitude is a signal considered valid for weld inspection.
To enhance the system’s robustness against variable ultrasound generation amplitude, a signal processing step divides the postweld ultrasonic power by the preweld power to obtain the transmitted power through the weld, as illustrated in Fig 2. If the transmitted power falls below a pre adjusted threshold, the location is flagged as a zone where potential lack of fusion can be present, otherwise the location is considered to have complete fusion. While the amount of fusion is a continuous quantity that likely affects the transmitted power, a binary output is preferred for ease of use by operators. It should be noted that the threshold chosen is not universal and can depend on various factors, including steel grade, sheet thickness, and weld overlap. An adjustment step is described in the following section.
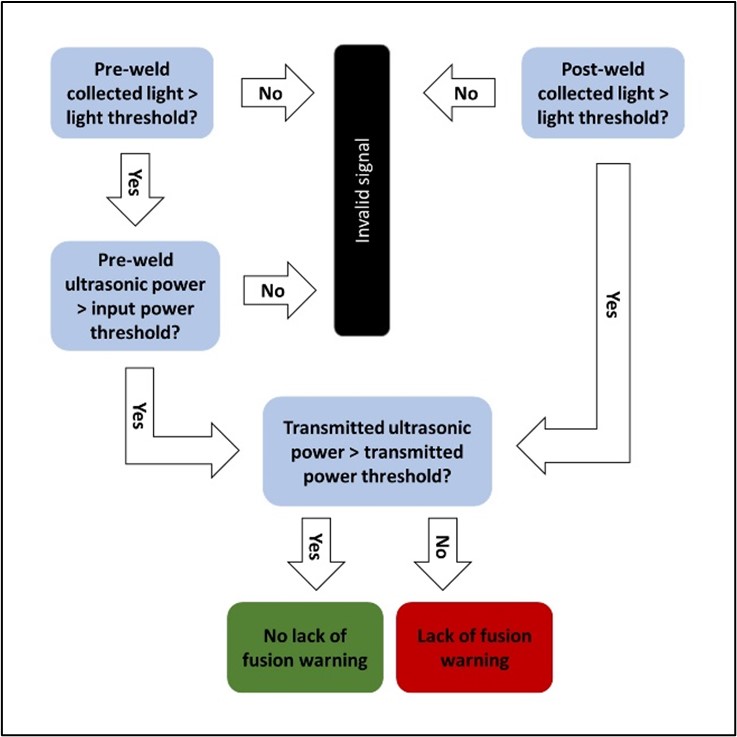
Figure 3 Decision making hierarchy for determining lack of fusion at each measurement location.
2.4 Transmitted power threshold adjustment
In order to determine the most appropriate LOF warning threshold, an adjustment step is necessary, as illustrated in the following example. A variety of weld qualities were produced by varying the electrode current, beginning slightly above the nominal value for the first weld and decreasing for each subsequent weld until reaching to zero (Table 1). The current within each weld was kept spatially constant throughout the weld length. The two sheets being joined were the same aluminum killed low-carbon steel coils, with dimensions of 0.975 mm thickness and 1009 mm width. Weld #2 used the nominal current typically used for joining these coils together. The Weldspector made measurements on the forward carriage pass as the weld was being made, and the welds were cut out and visually inspected afterwards for complete or partial LOF defects. Two sections of each weld were examined using metallography. Weld #8 was used to adjust the transmitted power threshold because, out of all welds with visually identified LOF, it had the electrode current closest to the standard electrode current used at this facility.
Table 1 Electrode current for each weld made, relative to the maximum current that the welder is capable of.
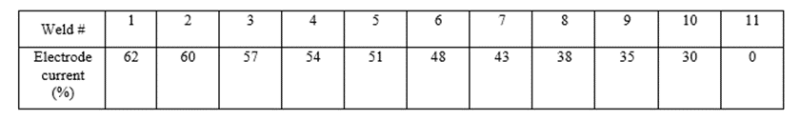
Figure 4a illustrates the transmitted power for a weld (#8) that has been verified to contain LOF defects. The transmitted power is defined as the ratio of post-weld power at each point. The picture of the weld is shown directly below the graph. The weld contains two regions of LOF defects that have been visually identified after completion. Partial LOF defects refer to locations where at least one of the weld edges is lifted, but some portion of the sheet overlap has fused together. Complete LOF defects refer to location with a visible air gap between the sheets. Two holes previously stamped in the sheets lie along the length of the weld and are omitted because they do not represent realistic defects. In both visually identified LOF zones (before 216 mm and after 671 mm) there is a clear decrease in transmitted power as expected due to the acoustic impedance mismatch between air and steel. However, a few points of the LOF zones show a small increase in signal, which may be due to local contact stress from bending of the sheets, but the transmitted power remains low for most points.
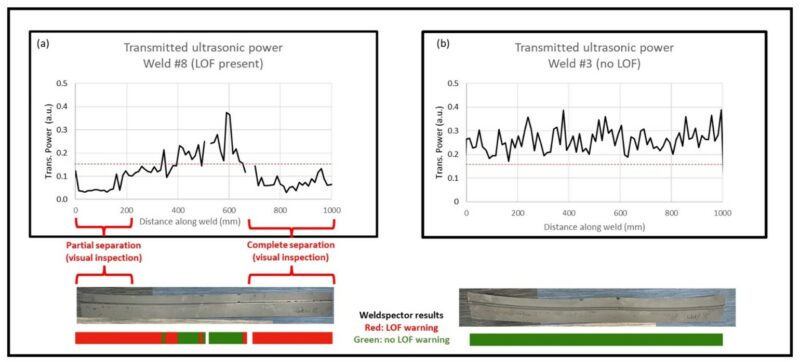
Figure 4. a) Transmitted ultrasonic power for weld #8, which contained two sections of verified lack of fusion. The dotted red line indicates the selected threshold, below which the lack of fusion test is failed. Below the transmitted power is a picture of the weld after being cut out, and below that, the result of the pass/fail decision-making process. Invalid signals and locations of pre-stamped holes are omitted. b) Same as figure 4a but for weld #3, for which no lack of fusion was observed after the weld was cut out and inspected visually.
In contrast to weld (#8), weld #3 (welded at slightly lower than nominal welding current) did not have any visually identified LOF, as depicted in Fig. 4b. The transmitted power of weld #3 is higher than that of the LOF zone in weld #8, and of a similar magnitude to the non-LOF zone. Based on these two welds, a transmitted power threshold of 0.15 was selected for the LOF warning. This threshold ensured that all locations within the two visually identified LOF zones on weld #8 were detected and no false alarms were raised for points on weld #3. It is worth noting that the presence of a partial crack on weld #8 made visual inspection challenging. By adjusting the transmitted power threshold, the Weldspector detected more defective weld length than the visual inspection. However, visual inspection can only identify surface defects and may not detect subtle defects such as short LOF lengths or internal voids, as shown by metallography in the following section. The chosen threshold will be tested against 9 other welds of different electrode currents, and the results compared to visual inspection and metallography.
RESULTS AND DISCUSSION
With the transmitted power warning threshold determined from the previous adjustment step, the percent LOF warning of entire welds can now be analyzed for the different electrode settings. In Figure 5, the percent length of each weld in which the Weldspector produced a LOF warning is compared to visual inspection. As expected, it is observed that the Weldspector produces a greater percent length LOF than the visual inspection for weld #9, similar to weld #8, as was discussed in the previous section when adjusting the LOF warning threshold. Additionally, it matches the 100% length LOF for welds 10 and 11, for which the two sheets were completely separated after being cut out by the welder machine.
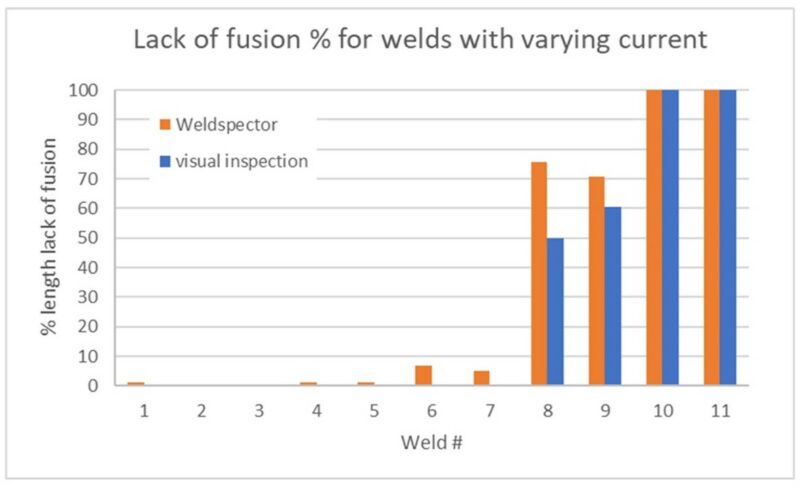
Figure 5 Comparison of percent length lack of fusion found with either the Weldspector or visual inspection. The welding parameters for each weld are shown in table 1.
Our approach is exemplified by weld #7, where the Weldspector issued three consecutive LOF warnings at the beginning of the weld, from 12 mm to 49 mm (measured from the start of the weld) and one more at 62 mm. Metallography was conducted at 49 mm and confirmed existence of LOF (Fig. 6). It should be noted that the Weldspector had a spatial resolution of 12 mm for this weld, so the measurement’s defective region may have extended up to 61 mm. Even if the complete fracture observed with metallography was due to the preparation, it would still indicate that the weld at this location was weaker and contained some LOF defects. Metallography for all the other weld cross sections did not show LOF under the same preparation. A case study of a weld break on a similar galvanizing line revealed that the rupture initiated at the weld edge due to lack of fusion, demonstrating the importance of volumetric inspection within this critical region3. Since the metallography only represents a single point, it is not included in the comparison to the Weldspector in Fig. 5, thus in general for all the other test welds, the visual inspection having a slightly lower % LOF is not necessarily a sign of the Weldspector’s inaccuracy. Three out of five locations that gave a LOF on weld #6 were within 200 mm from the beginning, where LOF tended to occur during this test, however, we cannot rule out false warnings at this moment. The rest of the samples gave one Weldspector LOF warning at most, and no apparent defective areas were identified by visual inspection or metallography.
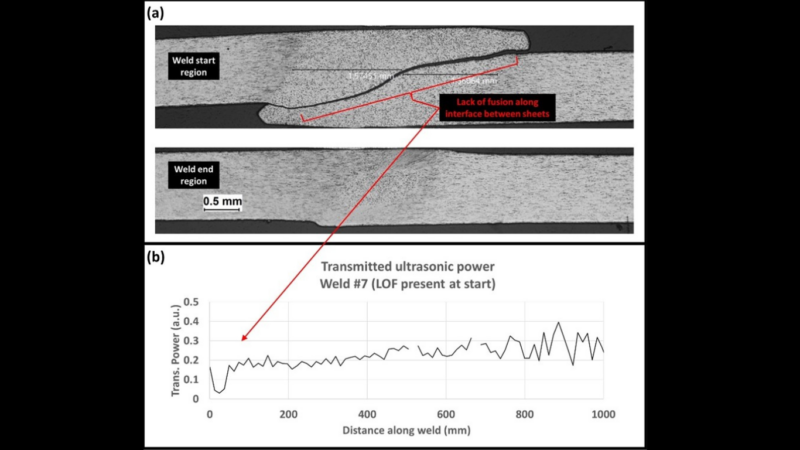
Figure 6 a) Metallography taken at the beginning (top image) and end (bottom image) section of weld #7. b) Transmitted power for weld #7.
Although the bad welds in this test were made intentionally by reducing the current to artificially decrease the heat, it is important to note that LOF defects can occur in other scenarios as well. For instance, the presence of scale on the sheets prior to welding can cause LOF, as was shown in the previously mentioned breakage case study at a continuous galvanizing facility3. In this case study, the scale’s electrical insulating properties on the surface led to a local temperature rise, which may obscure the defect when monitoring the weld via surface temperature methods like pyrometers or thermography. This finding supports the need for a volumetric detection method like the Weldspector.
Weldspector operator user interface
To make the Weldspector system useful for operators on the factory floor, a user interface must be designed that can be quickly and easily read alongside other important information. Figure 7 shows the first version of our operator view which uses two additional welds from the earlier data set as examples. On the left side of the interface, there is a spatial chart of the pass/fail outcome for each location along the weld. If a shot is invalid due to low collected light or preweld power, it is blank, as can be seen from the case of the two holes pre-stamped in the sheet metal in Fig 7b. On the right side, there is a bar chart summarizing the entire weld in percent length pass/fail with an additional intermediate category of “warning” that can be added to indicate the proximity to the “fail” threshold. The final outcome of the Weldspector system is a go/no-go decision for the weld as a whole, determined when a weld contains more than a certain number of LOF locations, as indicated by the green checkmark or red x in the circle next to the weld ID number. At the time of publication, this Weldspector interface is being provided to the operator during regular production to help them quickly assess the weld’s quality.
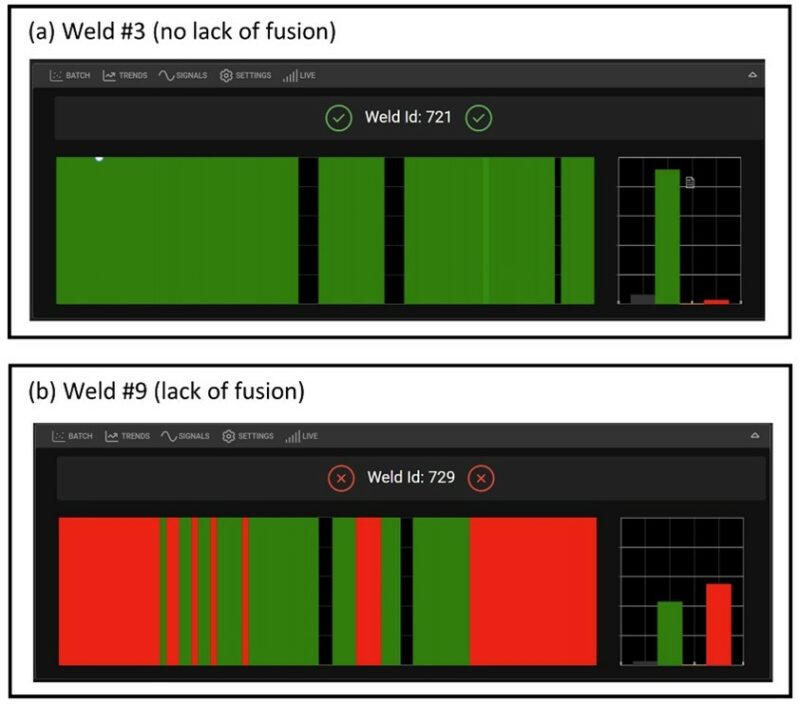
Figure 7 Weldspector operator interface and example results for a weld containing a) no lack of fusion locations and b) lack of fusion locations. Red indicates lack of fusion, green indicates the weld is sound, and invalid signals (as described in Fig. 3) are blank. We note that all but one invalid signal was due to the presence of pre-stamped holes in the coils.
CONCLUSIONS
In summary, we showed the development of lack of fusion detection by using a prototype of the Weldspector, a volumetric, fully non-contact weld qualification sensor. Measurements were taken without issue as the weld was made by attaching the Weldspector to an on-line overlap resistance seam welder. Eleven welds with varying welder current to induce defects were inspected for partial and complete lack of fusion by visual and metallographic methods. All known defects using these methods were detected as expected after using two welds to adjust the threshold at which a warning occurs. The whole regions identified as containing lack of fusion defects with visual inspection were also flagged by the Weldspector, in addition to other locations.
One of these additional locations was investigated further by metallography, which confirmed that the location, although having passed the visual inspection, indeed contained a lack of fusion defect at the weld edge, which has been known to be the cause of breaks. This situation demonstrates the capability of the Weldspector’s inspection system to detect defects directly at the weld interface, which may pass under other on-line surface inspection methods. This situation demonstrates the capability of the Weldspector’s inspection system to detect defects directly at the weld interface, which may pass under other on-line surface inspection methods.
The system remains online at the time of writing and continues to collect data.
REFERENCES
[1] ‘2022 World Steel in Figures’, World Steel Assiciation, 2022. https://worldsteel.org/steel-topics/statistics/world-steel-in-figures-2022/ (accessed Feb. 18, 2023).
[2] P. R. Bonikila, S. S. Indimath, and N. Shajan, ‘Failure assessment of Mash Seam Weld breakage and development of online weld inspection system for early detection of weld failure’, Eng Fail Anal, Vol. 133, Mar. 2022, doi: 10.1016/j.engfailanal.2021.105967.
[3] S. Pawar, S. Sahoo, and G. Mukhopadhyay, ‘Failure analysis of weld joint of high strength quality steel sheets in cold rolling mill’, Eng Fail Anal, Vol. 103, pp. 392–399, Sep. 2019, doi: 10.1016/j.engfailanal.2019.05.010.
[4] A. Poling, F. Bleich, and J. Drocton, ‘Developing a Robust Welding Method for Heavy Gauge DP590 At a Continuous Galvanizing Line’, in Galvanizers Association Annual Conference, Oct. 2018.
[5] R. Garza B. L., B. Montelongo V. J., L. Garcia P., and A. Treviño, ‘Analysis of Interruptions of Continuous Galvanizing Line by Weak Joints in Welding Process’, in 110th Meeting of the Galvanizers association, Oct. 2018.
[6] V. S. de Deus, J. A. Castro, and S. R. Correa, ‘Correlation among the input thermal parameters and thermography measurements data of the resistance seam welding’, Materials Research, Vol. 23, No. 1, 2020, doi: 10.1590/1980-5373-MR-2020-0029.
[7] M. Balle, ‘Automated IR-weld seam control’, in Proceedings Volume 1313, Thermosense XII: An International Conference on Thermal Sensing and Imaging Diagnostic Applications, Mar. 1990, Vol. 1313, pp. 332–339. doi: 10.1117/12.21938.
[8] S. S. Indimath, R. Shunmugasundaram, S. Balamurugan, M. Dutta, S. K. Gudimetla, and K. Kant, ‘Online ultrasonic technique for assessment of mash seam welds of thin steel sheets in a continuous galvanizing line’, International Journal of Advanced Manufacturing Technology, Vol. 91, No. 9–12, pp. 3481–3491, Aug. 2017, doi: 10.1007/s00170-017-9995-8.
[9] P. R. Bonikila, S. S. Indimath, and N. Shajan, ‘Failure assessment of Mash Seam Weld breakage and development of online weld inspection system for early detection of weld failure’, Eng Fail Anal, Vol. 133, Mar. 2022, doi: 10.1016/j.engfailanal.2021.105967.
[10] C. B. Scruby and L. E. Drain, Laser Ultrasonics: Techniques and Applications, 1st ed. New York: Routledge, 1990.
[11] M. D. Rogge, ‘IN-PROCESS SENSING OF WELD PENETRATION DEPTH USING NON-CONTACT LASER ULTRASOUND SYSTEM A Dissertation Presented to The Academic Faculty’, Georgia Institute of Technology, Atlanta, 2009. Accessed: Feb. 18, 2023. [Online]. Available: https://www.proquest.com/openview/ea4d79042e3959951f270759315ce65e/1?pq-origsite=gscholar&cbl=18750
[12] G. Diot, A. Koudri-David, H. Walaszek, S. Guégan, and J. Flifla, ‘Non-destructive testing of porosity in laser welded aluminium alloy plates: Laser ultrasound and frequency-bandwidth analysis’, J Nondestr Eval, Vol. 32, No. 4, pp. 354–361, Dec. 2013, doi: 10.1007/S10921-013-0189-5/METRICS.
[13] M. Miller, B. Mi, A. Kita, and I. C. Ume, ‘Development of automated real-time data acquisition system for robotic weld quality monitoring’, Mechatronics, Vol. 12, No. 9–10, pp. 1259–1269, Nov. 2002, doi: 10.1016/S0957-4158(02)00028-4.
[14] G. M. Graham and I. C. Ume, ‘Automated system for laser ultrasonic sensing of weld penetration’, Mechatronics, Vol. 7, No. 8, pp. 711–721, Dec. 1997, doi: 10.1016/S0957-4158(97)00031-7.
[15] M. Shaloo, M. Schnall, T. Klein, N. Huber, and B. Reitinger, ‘A Review of Non-Destructive Testing (NDT) Techniques for Defect Detection: Application to Fusion Welding and Future Wire Arc Additive Manufacturing Processes’, Materials 2022, Vol. 15, Page 3697, Vol. 15, No. 10, p. 3697, May 2022, doi: 10.3390/MA15103697.
[16] J. Monchalin et al., ‘Laser-Ultrasonics: From the Laboratory to the Shop Floor’, Advanced Performance Materials, Vol. 5, pp. 7–23, 1998.
[17] ‘Wall thickness gauges for hot seamless tube mills | Lut by Tecnar’, Tecnar Automation Ltée, 2023. https://laser-ut.tecnar.com/ (accessed Feb. 19, 2023).
[18] A. Blouin and J. P. Monchalin, ‘Detection of ultrasonic motion of a scattering surface by two‐wave mixing in a photorefractive GaAs crystal’, Appl Phys Lett, Vol. 65, No. 8, p. 932, Jun. 1998, doi: 10.1063/1.112153.
[19] B. W. Drinkwater, R. S. Dwyer-Joyce, and P. Cawley, ‘A study of the interaction between ultrasound and a partially contacting solid-solid interface’, Proceedings of the Royal Society A: Mathematical, Physical and Engineering Sciences, Vol. 452, No. 1955, pp. 2613–2628, 1996, doi: 10.1098/rspa.1996.0139.